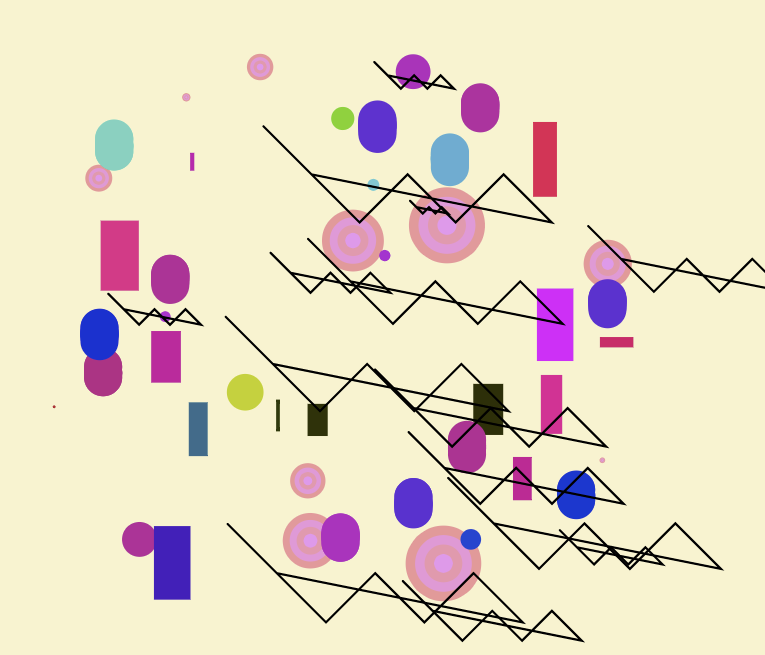
At the Music Visualization Hackathon, I collaborated with Michelle Chandra, Pam Liou and Ziv Schneider to create Kandinskify. You can check out the work in progress here.
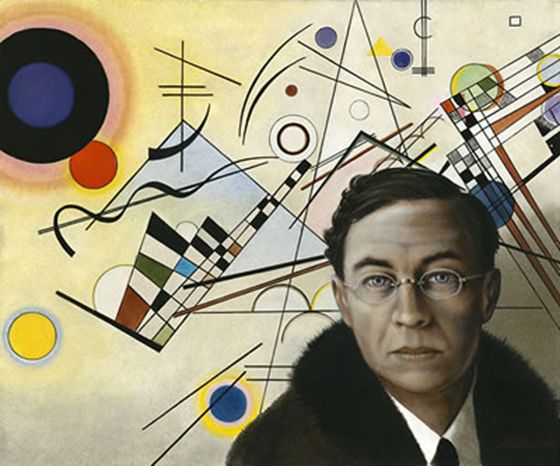
For inspiration, we looked to the history of music visualization. Ziv brought up Wassily Kandinsky, the Russian painter and art theorist.

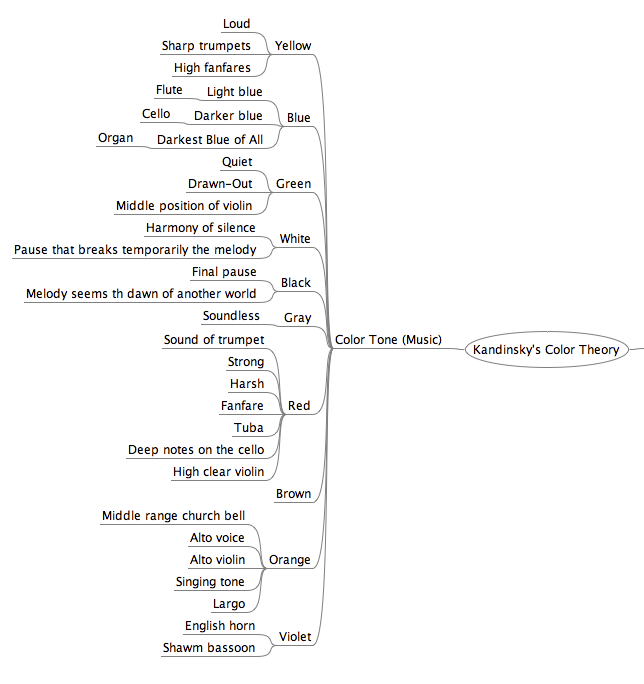
Kandinsky was fascinated by the relationship between music and color. He even developed a code for representing music through color:  We set about adapting Kandinsky’s code into a generative visualization. Kandinskify analyzes musical attributes of a song as it plays to create a digital painting in the style of Kandinsky.
Kandinsky’s musical attributes, like “Melody seems the dawn of another world,” are not easy to decipher with the human ear, let alone with a computer program. But we used the Echo Nest Track Analysis to figure out some useful attributes for a song, like ‘acousticness’ and ‘energy.’ We can use this information to determine the color palette of a song. The Echo Nest also offers a timestamped array of every beat in a song, which we used to determine when shapes should be drawn.
Kandinsky’s instrumentation like “Middle range church bell” can be hard to find in contemporary music. But with digital audio files, we are able to analyze the amplitude and frequency spectrum of a song as it plays, and it is possible to use this information to isolate certain instruments. We started out working with Zo0o0o0p!!! by Kidkanevil & Oddisee, one of my favorites from the Free Music Archive (though it may not have been Kandinsky’s choice). We were able to isolate the frequency ranges of certain instruments and map them to shapes. For example, the bell makes a spike at 7.5kHz and we mapped that to the oval shape. In the long run, we’d like to let users upload any song.
We used p5.js to create visuals on an HTML5 canvas. I’m developing an audio library for p5 as part of Google Summer of Code, so this was a fun opportunity to map audio to visuals with p5Sound.
The visual composition spirals out from the center in a radial pattern, inspired by this clip of Kandinsky drawing.
We’re planning to allow users to upload any song (or sound). We’re developing different color and shape palettes that will change based on the musical /sonic attributes. Kandinskify will analyze the music to create a unique generative visualization that will be different for every song. We’ll update the source code on github and demo here.

One thought on “Kandinskify: Kandinsky-inspired generative music visualizations”